Introduction
To ensure the proper accountability of travel carbon footprints many of our customers implement their full corporate hierarchy in the Thrust Calculator. However, depending on the size of your organisation you may have over 100 trackable budgets. To be useful, information about carbon budget consumption needs to be consumed in a filterable spreadsheet format. This is where the carbon budgets CSV export comes in helpful.
This Carbon Budgets CSV export enables you to generate a spreadsheet that includes the breakdown of carbon budgets from your organisation over a particular year. You will be able to view which departments of your organisation are over budget, and who is trending to go over budget by the end of the year.
1. Exporting the report
Navigate to the instance you want to generate the report in then click on the “Reporting” tab as shown below.

Scroll down on the reporting page to the “Export your segment” section and click on the “Generate export your segments” button outlined below.

A pop-up form will appear. First you need to select the export type, select “Budgets CSV” as shown below. Note that if you have not set up any budgets in your instance this will not be an option. Next select the year that you wish to view the carbon budgets for.
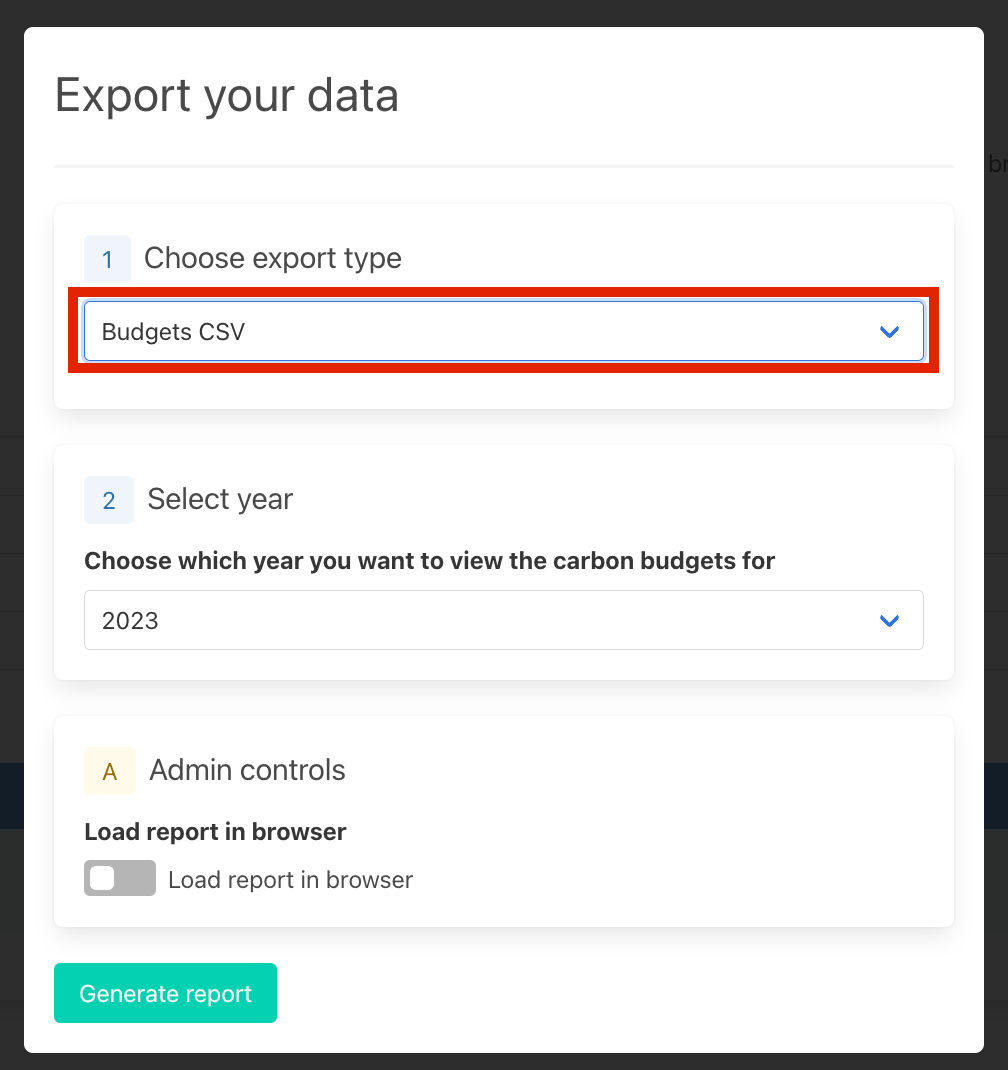
Next click the “Generate report” at the bottom left of the pop-up form to generate your CSV report.

2. Downloading the report
After generating your report a new row should appear with the status as pending. The name of your new file will be the “[name of the instance] - Export - [date of export]”.
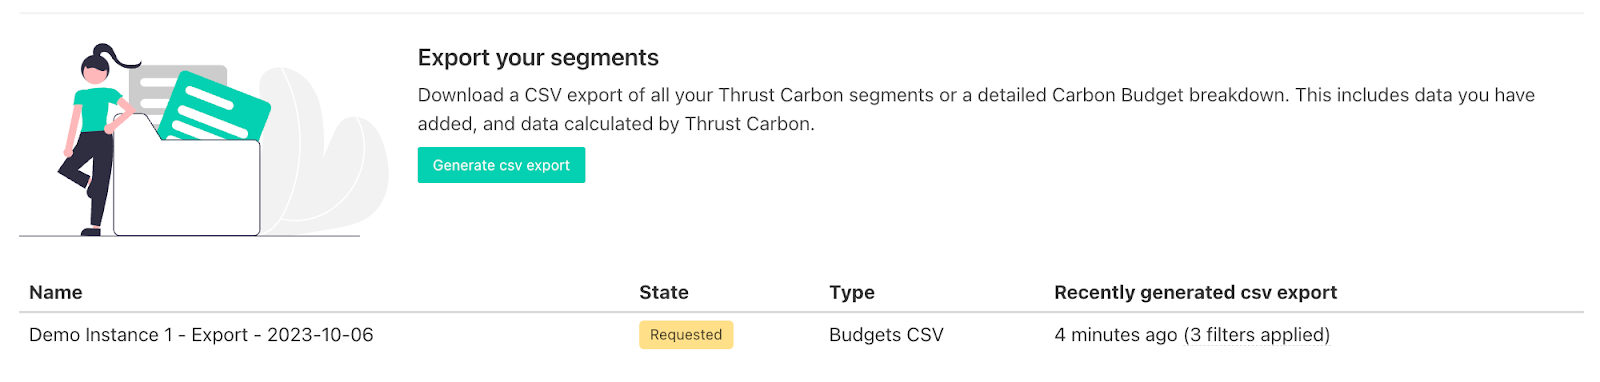
When the file is completed the status will change to completed and you can download the data using the download button shown below.
![]()
3. Explaining the structure of the CSV export
The CSV budgets file includes a monthly breakdown of the travel emissions from air, hotel, rail, car and the total emissions for each grouping. In addition the total carbon budget for each grouping is stated along with the trending utilisation as a percentage and value in tonnes CO2e.
The structure of the report is explained below:
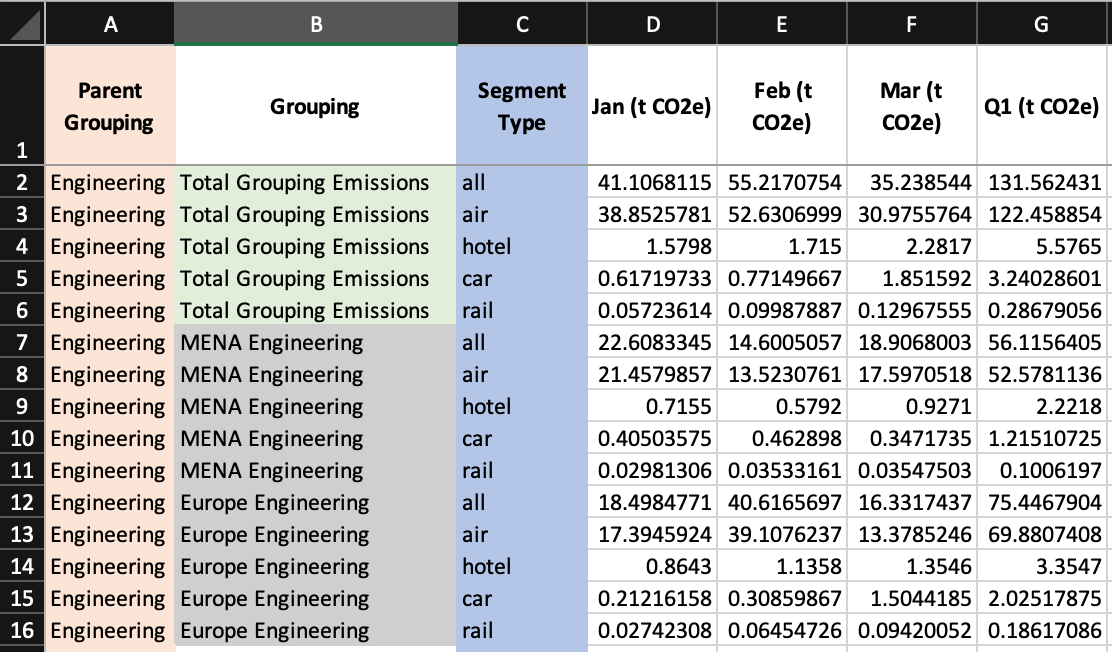
In column A there is the “Parent Grouping” which states the top level grouping within the grouping type. In this case the parent grouping is “Engineering” which has 2 sub-groupings underneath it: MENA Engineering and Europe Engineering (in grey).
In column B, highlighted in green we also have “Total Grouping Emissions”, in these rows we can see what the total emissions are for the whole of Engineering for each segment type (Column C). For example if you wanted to know what the total emissions from Engineering were in Q1 from Air you would look along row 2 to column G (Q1) to see that the emission is 122.46 t CO2e. Likewise if you were only interested in the total emissions from MENA Engineering in Q1, you would look in cell G7.
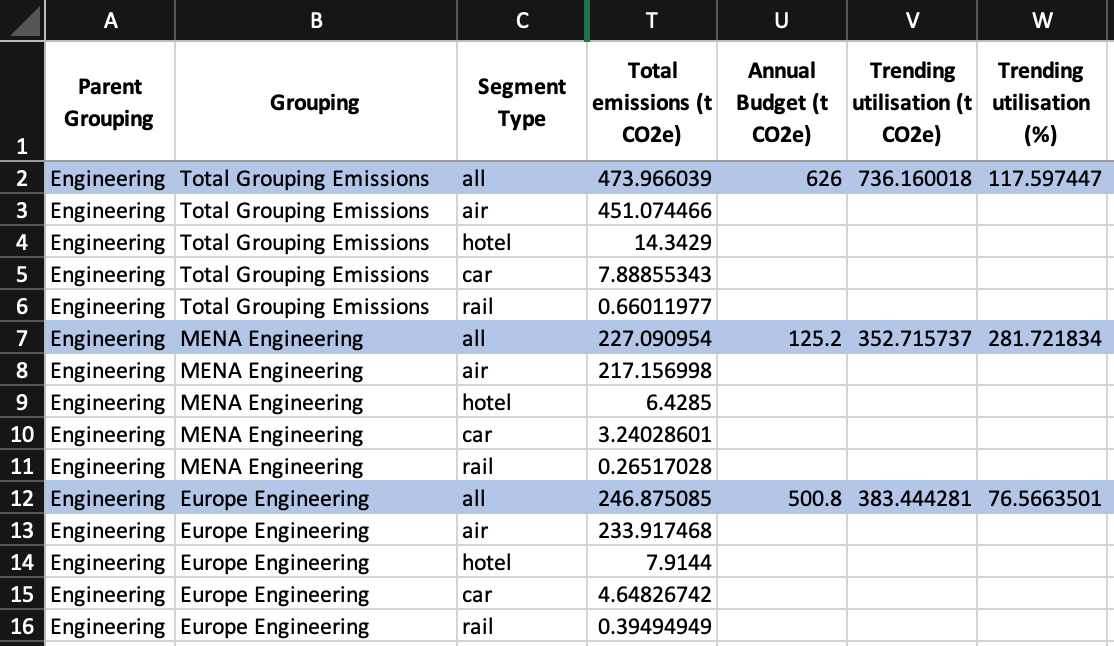
The monthly breakdown continues to December, along with emissions from Q1-Q4. The screenshot below shows the total emissions for each grouping for the segment types. In addition the Annual Budget is shown in column U for each grouping. The Trending Utilisation is shown in columns V and W, and this demonstrates the estimated carbon emissions at the end of the year if you have pulled the report mid-year.
For example, in cell T12 we can see the total emissions for the grouping “Europe Engineering” is 246.88 t CO2e, while cell U12 shows the annual budget as 500.8 t CO2e. Europe Engineering is estimated to be under budget, utilising only 76.57% of their annual budget, this is shown in column V12.
Was this article helpful?
That’s Great!
Thank you for your feedback
Sorry! We couldn't be helpful
Thank you for your feedback
Feedback sent
We appreciate your effort and will try to fix the article